
Analytics Phantom Pro
Where your server is heading, not just where it is. Analytics turns Phantom's nightly snapshots into growth trends, a forecast, engagement and retention figures, a breakdown of how the server is laid out, and plain-English tips about what to do next.
Phantom Pro feature
Analytics is part of Phantom Pro — £4.99/month or £49.99/year for one server. Free servers can open the page and see the real layout filled with sample data, so you know exactly what you'd be buying before you buy it.
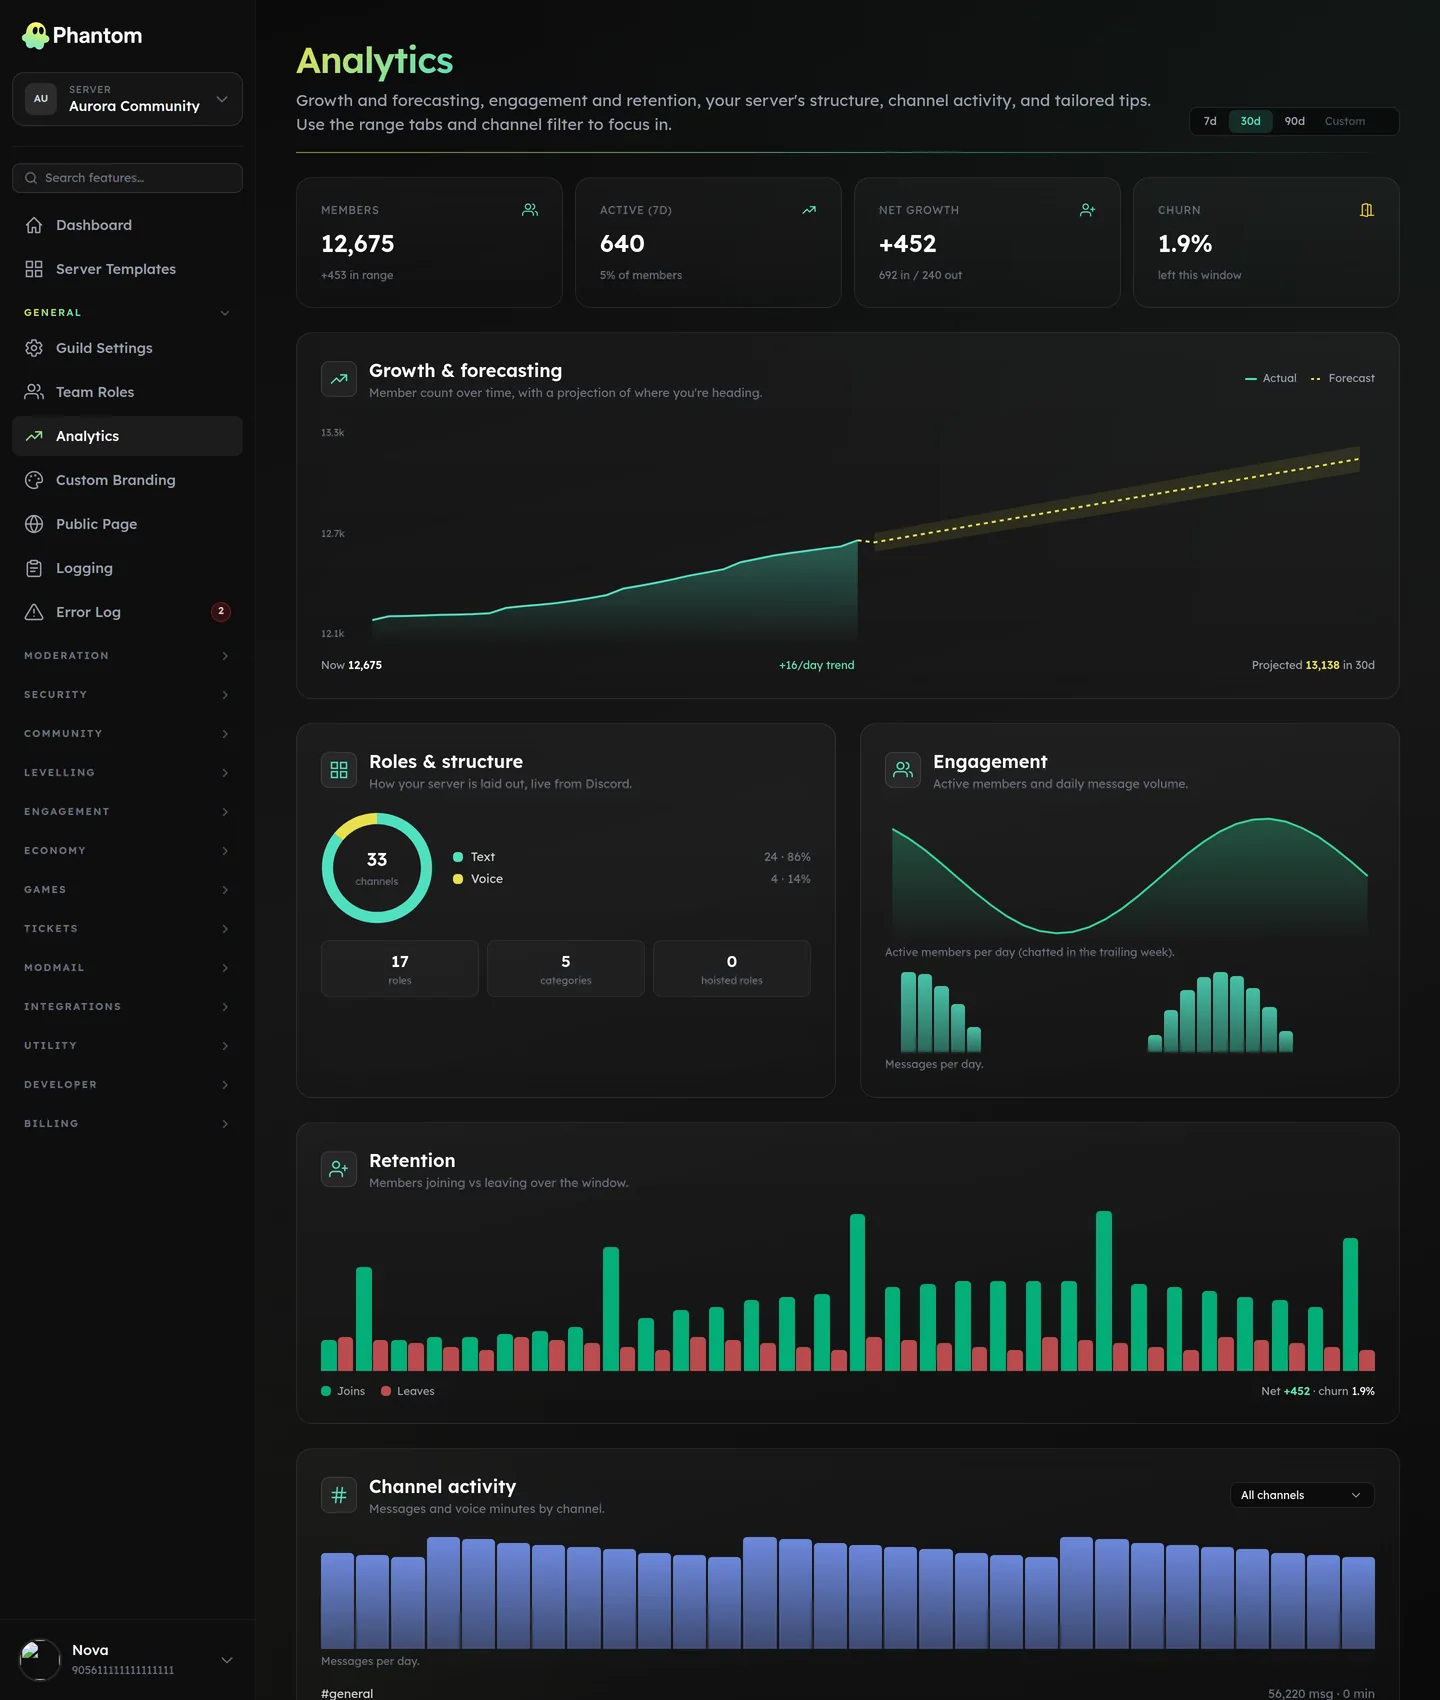 General → Analytics, on the 30-day range.
Where it lives
Dashboard: General → Analytics.
The four cards at the top
| Card | What it tells you |
|---|---|
| Members | Total members now, and how much that moved across the range. |
| Active | How many members actually chatted in the trailing week, and what share of the server that is. |
| Net growth | Joins minus leaves for the range, with both raw numbers alongside. |
| Churn | The share of members who left during the window. |
Growth & forecasting
The line is your real member count, day by day. The dotted continuation is a projection from the trend in the window you're looking at, with a shaded band for the uncertainty.
The forecast only appears once there's enough history to fit a trend to — a server Phantom joined last week gets "waiting for more data" rather than a confident line drawn through three points. Snapshots are taken nightly, so a brand-new install starts producing this within a few days.
Roles & structure
A live read of how the server is laid out, straight from Discord rather than from the snapshots: how many channels of each type, how many categories, how many roles, and how many of those roles are hoisted. Useful for spotting the slow sprawl that makes a server hard to navigate.
Engagement
Active members per day and message volume per day, side by side. When the two diverge — volume up, active members flat — a handful of people are carrying the conversation.
Retention
Joins against leaves for every day in the window, so a spike of arrivals that left again the same week is obvious. The net figure and churn percentage for the window sit under the chart.
Channel activity
Messages and voice minutes per channel. Use the channel filter at the top of the page to narrow every chart on the page to one channel.
Tips
Under the charts, Phantom writes a short list of observations in plain English — membership trending down, a low active share, voice channels going unused, a channel that has gone quiet. These are rule-based readings of the numbers above, not predictions: they tell you what the data says and suggest the obvious next move.
Ranges
Preset ranges are 7 days, 30 days (the default) and 90 days, plus a custom range up to 365 days. Snapshots are kept for two years, so a long custom range keeps working as your server ages.
Permissions
Analytics isn't mapped to a team-role permission, so it's owner and Discord Administrator only — team roles can't be granted access to it the way they can for moderation or tickets. The page is read-only either way; there's nothing on it to change.
Related pages
- Invite Tracking — where your joins are actually coming from
- Levelling leaderboard — who your most active members are
- Channel Stats — live counters in Discord itself
- Pricing & Phantom Pro — what else Pro unlocks